Dashboard
Strivacity's dashboard gives you deep insights into the health of your customer identity ecosystem, ensuring you have the insights needed to meet your brand's login, account onboarding, and security objectives.

The Strivacity dashboard
Capabilities
- Three out-of-the-box dashboards configured for operations, account onboarding, and security use cases.
- Create additional custom dashboards.
- Filter the entire board on a per-widget basis.
- Filter by date range, application client, or A/B test variant.
- Click a widget data point to open the Account events page with the same filters applied.
- Show the same data with different chart views.
- Add multiple widgets of the same metric with different filters to compare different date ranges or applications.
- Some response time and duration widgets support percentile views (P50, P95, P99, and P100), allowing administrators to analyze typical, high-percentile, and maximum execution times.
- Export dashboards to CSV or PDF.
Create a new dashboard
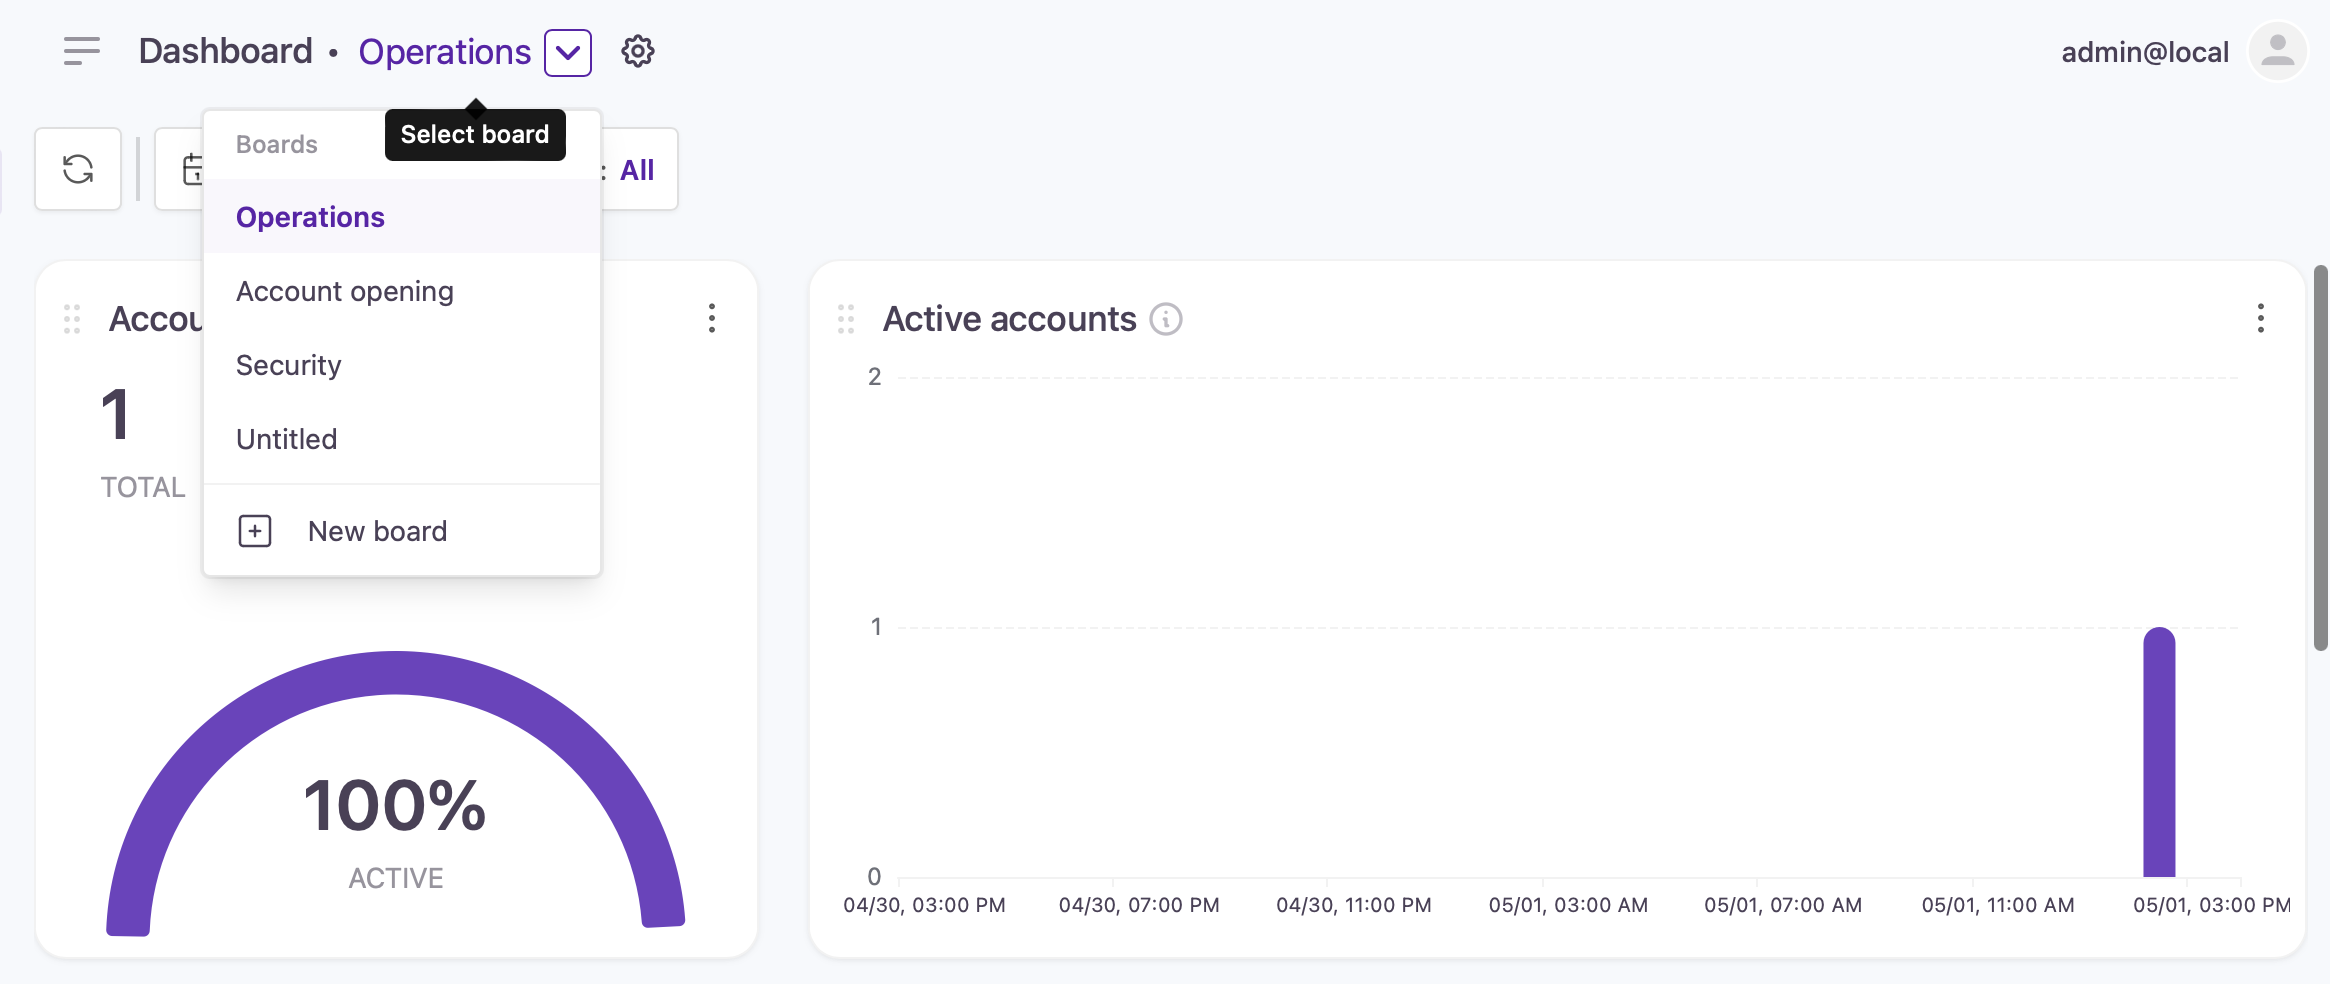
Selecting and creating dashboards
- Click the current dashboard name and select + New board.
- Select whether you want to start adding custom widgets or start with a board template.
- Add new widgets to the board by clicking the ⚙️ icon and selecting Add widgets.
- Filter the data by timestamp using the date filter.
- Filter the data by application using the application client filter.
- Use the (:) menu in a dashboard tile to select the chart type, add tile-scoped filtering, refresh the data, duplicate the tile, export to PDF, or delete the tile.
Any dashboard customizations, including filtering, changing widgets, or adding new dashboard tabs, only affect the administrator currently using the admin console. These changes are not shared with other admins.
Default dashboards
Default dashboards are preconfigured boards that give administrators an immediate view into key areas of account activity without needing to build widgets from scratch. Each template is designed around a specific use case (such as operations, security, or developer troubleshooting) and comes with a curated set of widgets already arranged on the board. These templates provide a starting point you can use as-is or customize further by adding, removing, or filtering widgets to fit your brand’s needs.
Operations
Offers detailed insights into login operations, tracking key metrics such as login success rates, failure reasons, and abandonment trends. Used to optimize user authentication processes and enhance overall user experience.
Included widgets:
- Total active accounts
- Active accounts vs. total accounts
- Total identities
- Login success, failure, abandonment
- External login usage
Account opening
Provides visibility into customer registration processes, onboarding success rates, and abandonment trends, so you can optimize your customer acquisition strategies.
Included widgets:
- Registration success/failure/abandonment
- Registration failure reasons
- Registration median times
- Total customer identities
- Identity verification and fraud transactions
- Identity verification step outcomes
- Identity verification policy outcomes
- MFA registrations
- External login registrations
Registration metrics are only collected during an interactive registration. API initated registrations/account creations are not currently tracked.
Agentic AI
Tracks how your customers adopt AI agents: how many accounts have authorized an agent, and how agent authorizations change over time.
Included widgets:
- Agent adoption
- Agents added & removed over time
Security
Displays security metrics, including login attempts, authentication successes, and failures. Used to monitor for potential threats and safeguard customer data integrity.
Included widgets:
- Username reminders
- Password resets
- Login failures
- Blocked sessions - reasons
- Stepped-up logins - reasons
- Stepped-down login - reasons
- Adaptive access authentications by type
A/B testing
Provides side-by-side visibility into registration metrics for baseline and variant user experiences. Enables data-driven evaluation of registration flow changes to optimize user onboarding and conversion. You must create and select a variant to see comparative data.
Included widgets:
- Registrations (baseline and variant)
- Registration abandoned steps (baseline and variant)
- Successful registration duration (baseline and variant)
- Consent activity (baseline and variant)
This template is designed for comparing baseline and variant journeys. You must create and select a variant to see comparative data.
Consent acceptance
Enables CIAM administrators to analyze user consent agreement activity in context with registration behavior. It tracks when and how users engage with consent prompts and compares this data to overall registration.
Included widgets:
- Consent activity
- Registrations
- Registration abandoned steps
On-premises
Provides real-time visibility into the health and performance of on-premises components. It surfaces key operational metrics, including update statuses, failure counts, error codes, and response times. Designed to support monitoring and troubleshooting of on-premises identity integrations.
Included widgets:
- Logins
- Registrations
- Directory connector uptime status & failures
- Directory connector error codes
- Directory connector response times
Developer
Provides visibility into failed hook executions due to unhandled exceptions and hook errors that occur during hook execution.
Included widgets:
- Event hook execution time
- Event hook errors
Metric list
You can add widgets when creating new boards or customize existing boards by adding widgets. The list below shows all the metrics that can be displayed through these widgets.
| Metric | Description |
|---|---|
| Active accounts | Displays the number of accounts that have been active within a given month, providing insights into customer engagement and platform usage over time. |
| Account engagement | Compares active accounts to total accounts, highlighting customer engagement and platform adoption. |
| Logins | Displays the counts of successful logins, login failures, and login abandonments, offering a comprehensive overview of login activity and customer behavior. |
| Login success | Displays the number of successful login attempts over a specified timeframe, indicating the efficacy of authentication processes and system accessibility. |
| Login failure | Tracks the frequency of unsuccessful login attempts, offering insights into potential security threats and authentication issues. |
| Login failure reasons | Highlights the top reasons for login failures along with the corresponding steps in the authentication process. Use to identify common issues and potential points of improvement. |
| Login abandonment | Shows the number of instances where customers abandon the login process before completion, indicating potential usability challenges or barriers to access. |
| Abandoned login steps | Highlights the top steps where customers commonly abandon the login process, offering insights into potential usability issues or obstacles to customer engagement. |
| Registrations | Displays the counts of successful registrations, registration failures, and registration abandonments, providing insights into the effectiveness of the registration process and customer engagement. |
| Registration success | Displays the number of successful registrations within a specified period. |
| Successful registration duration | Shows the time spent on individual registration screens before successful completion, helping identify potential bottlenecks or areas for streamlining the registration process. Supports P50, P95, P99, and P100 percentile views. The default view is P50. |
| Registration failure | Tracks the number of failed registration attempts over a specified period, highlighting potential obstacles in the process and areas for improvement. |
| Registration failure reasons | Highlights the top reasons for registration failures along with the corresponding steps in the process, aiding of common issues and potential points of improvement. |
| Failed registration duration | Shows the median time spent on each registration screen before a registration failure occurs, offering insights into potential usability issues or points of friction in the registration process. |
| Registration abandoned steps | Highlights the top steps or screens where customers commonly abandon the registration process, pinpointing potential usability hurdles or areas for improvement in customer experience. |
| Registration abandonment | Shows the number of instances where customers abandon the registration process before completion, indicating potential usability challenges. |
| Adaptive rule events | Provides insights into the effectiveness of adaptive access rules by indicating the number of blocked sessions due to security policy violations and stepped-up/stepped-down authentication measures. |
| Blocked sessions | Tracks the number of sessions blocked due to security concerns or violations, providing insights into attempted unauthorized access and the effectiveness of security measures. |
| Blocked session reasons | Highlights the primary reasons for session blocks, offering insights into security threats and potential vulnerabilities in the system. |
| Stepped-up logins | Indicates the number of login attempts that triggered stepped-up authentication measures, offering insights into security triggers and potential risks. |
| Stepped-up login reasons | Highlights the primary reasons triggering stepped-up authentication during login attempts, aiding in the identification of potential security threats and risk factors. |
| Stepped-down logins | Indicates the number of login attempts that triggered stepped-down authentication measures, offering insights into security triggers and potential risks. |
| Stepped-down login reasons | Highlights the primary reasons triggering stepped-down authentication during login attempts, aiding in the identification of potential security threats and risk factors. |
| External logins | Shows the frequency of external login attempts categorized by provider configuration, offering insights into customer preferences and authentication sources. |
| External registrations | Shows registrations based on external provider setup, aiding in understanding customer preferences for authentication sources. |
| Forgotten username requests | Illustrates the successful and failed resolution of forgotten username requests, indicating the efficiency of customer support and account recovery processes. |
| Password resets | Displays the successful and failed number of password resets, indicating the effectiveness of customer support and account security measures. |
| MFA authentications | Shows the distribution of MFA methods used, aiding in understanding authentication preferences. |
| Agent adoption | Displays the share of accounts with at least one authorized agent, the number of agents granted access, and how many of those agents are active versus dormant. |
| Agents added & removed over time | Displays agent authorizations granted and revoked over the selected period, so you can track growth and churn in agent usage. |
| MFA enrollments | Shows the total registrations with MFA, highlighting enhanced security measures. |
| Identity verification and fraud transactions | Illustrates the utilization of identity verification services alongside fraudulent transaction detection measures, offering insights into security protocols and risk management strategies. |
| Voice call/SMS and email resend requests | Tracks the count of resend requests that occurred while using Strivacity messaging services. Used to track instances where messages were not successfully delivered initially due to issues, prompting re-attempts for successful delivery. Does not count Emails Ide sent via 3rd-party SMTP servers. |
| Account lockout | Tracks the number of account lockouts, helping identify possible threats or excessive failed login attempts. |
| Login attempts with disabled accounts | Tracks the number of login attempts with disabled accounts, helping identify potential security reasons or customer access issues. |
| Consent activity | Tracks the total acceptance and total revocation numbers, providing filtering by specific consents and their versions. |
| Directory connector uptime status & failures | Monitor the health of Directory connectors with counts of connection errors, unexpected failures, and uptime history. |
| Directory connector error codes | Highlights the top error codes for Directory connector operations. |
| Directory connector response times | Tracks Directory connector performance with counts of total round-trip, queue times, and datastore response times. Supports P50, P95, P99, and P100 percentile views. The default view is P99. |
| Event hook errors | Tracks failed hook executions caused by unhandled exceptions or errors during execution. Provides visibility into reliability issues with lifecycle event hooks. Can be filtered by date, hook, application client, or variant. |
| Event hook execution time | Shows the execution time (in milliseconds) for each lifecycle event hook, helping developers identify performance bottlenecks and monitor hook responsiveness. Can be filtered by date, application client, hook, or variant. Supports P50, P95, P99, and P100 percentile views. The default view is P99. |
| Identity verification step outcomes | Tracks step-level outcomes (success, failure, abandonment) for a single identity verification method within a policy. Helps assess how well an individual method performs and where customers most often drop off during that step. |
| Identity verification policy outcomes | Compares step-level outcomes across all identity verification methods within a selected policy, showing how each method contributes to overall success, failure, or abandonment. Helps identify which steps cause friction and evaluate the effectiveness of fallback strategies. |
Percentile viewsSome duration and response-time widgets support percentile views to help identify typical performance, performance outliers, and maximum response times.
- P50: Median value.
- P95: Value below which 95% of measurements fall.
- P99: Value below which 99% of measurements fall.
- P100: Maximum recorded value.
Updated 13 days ago