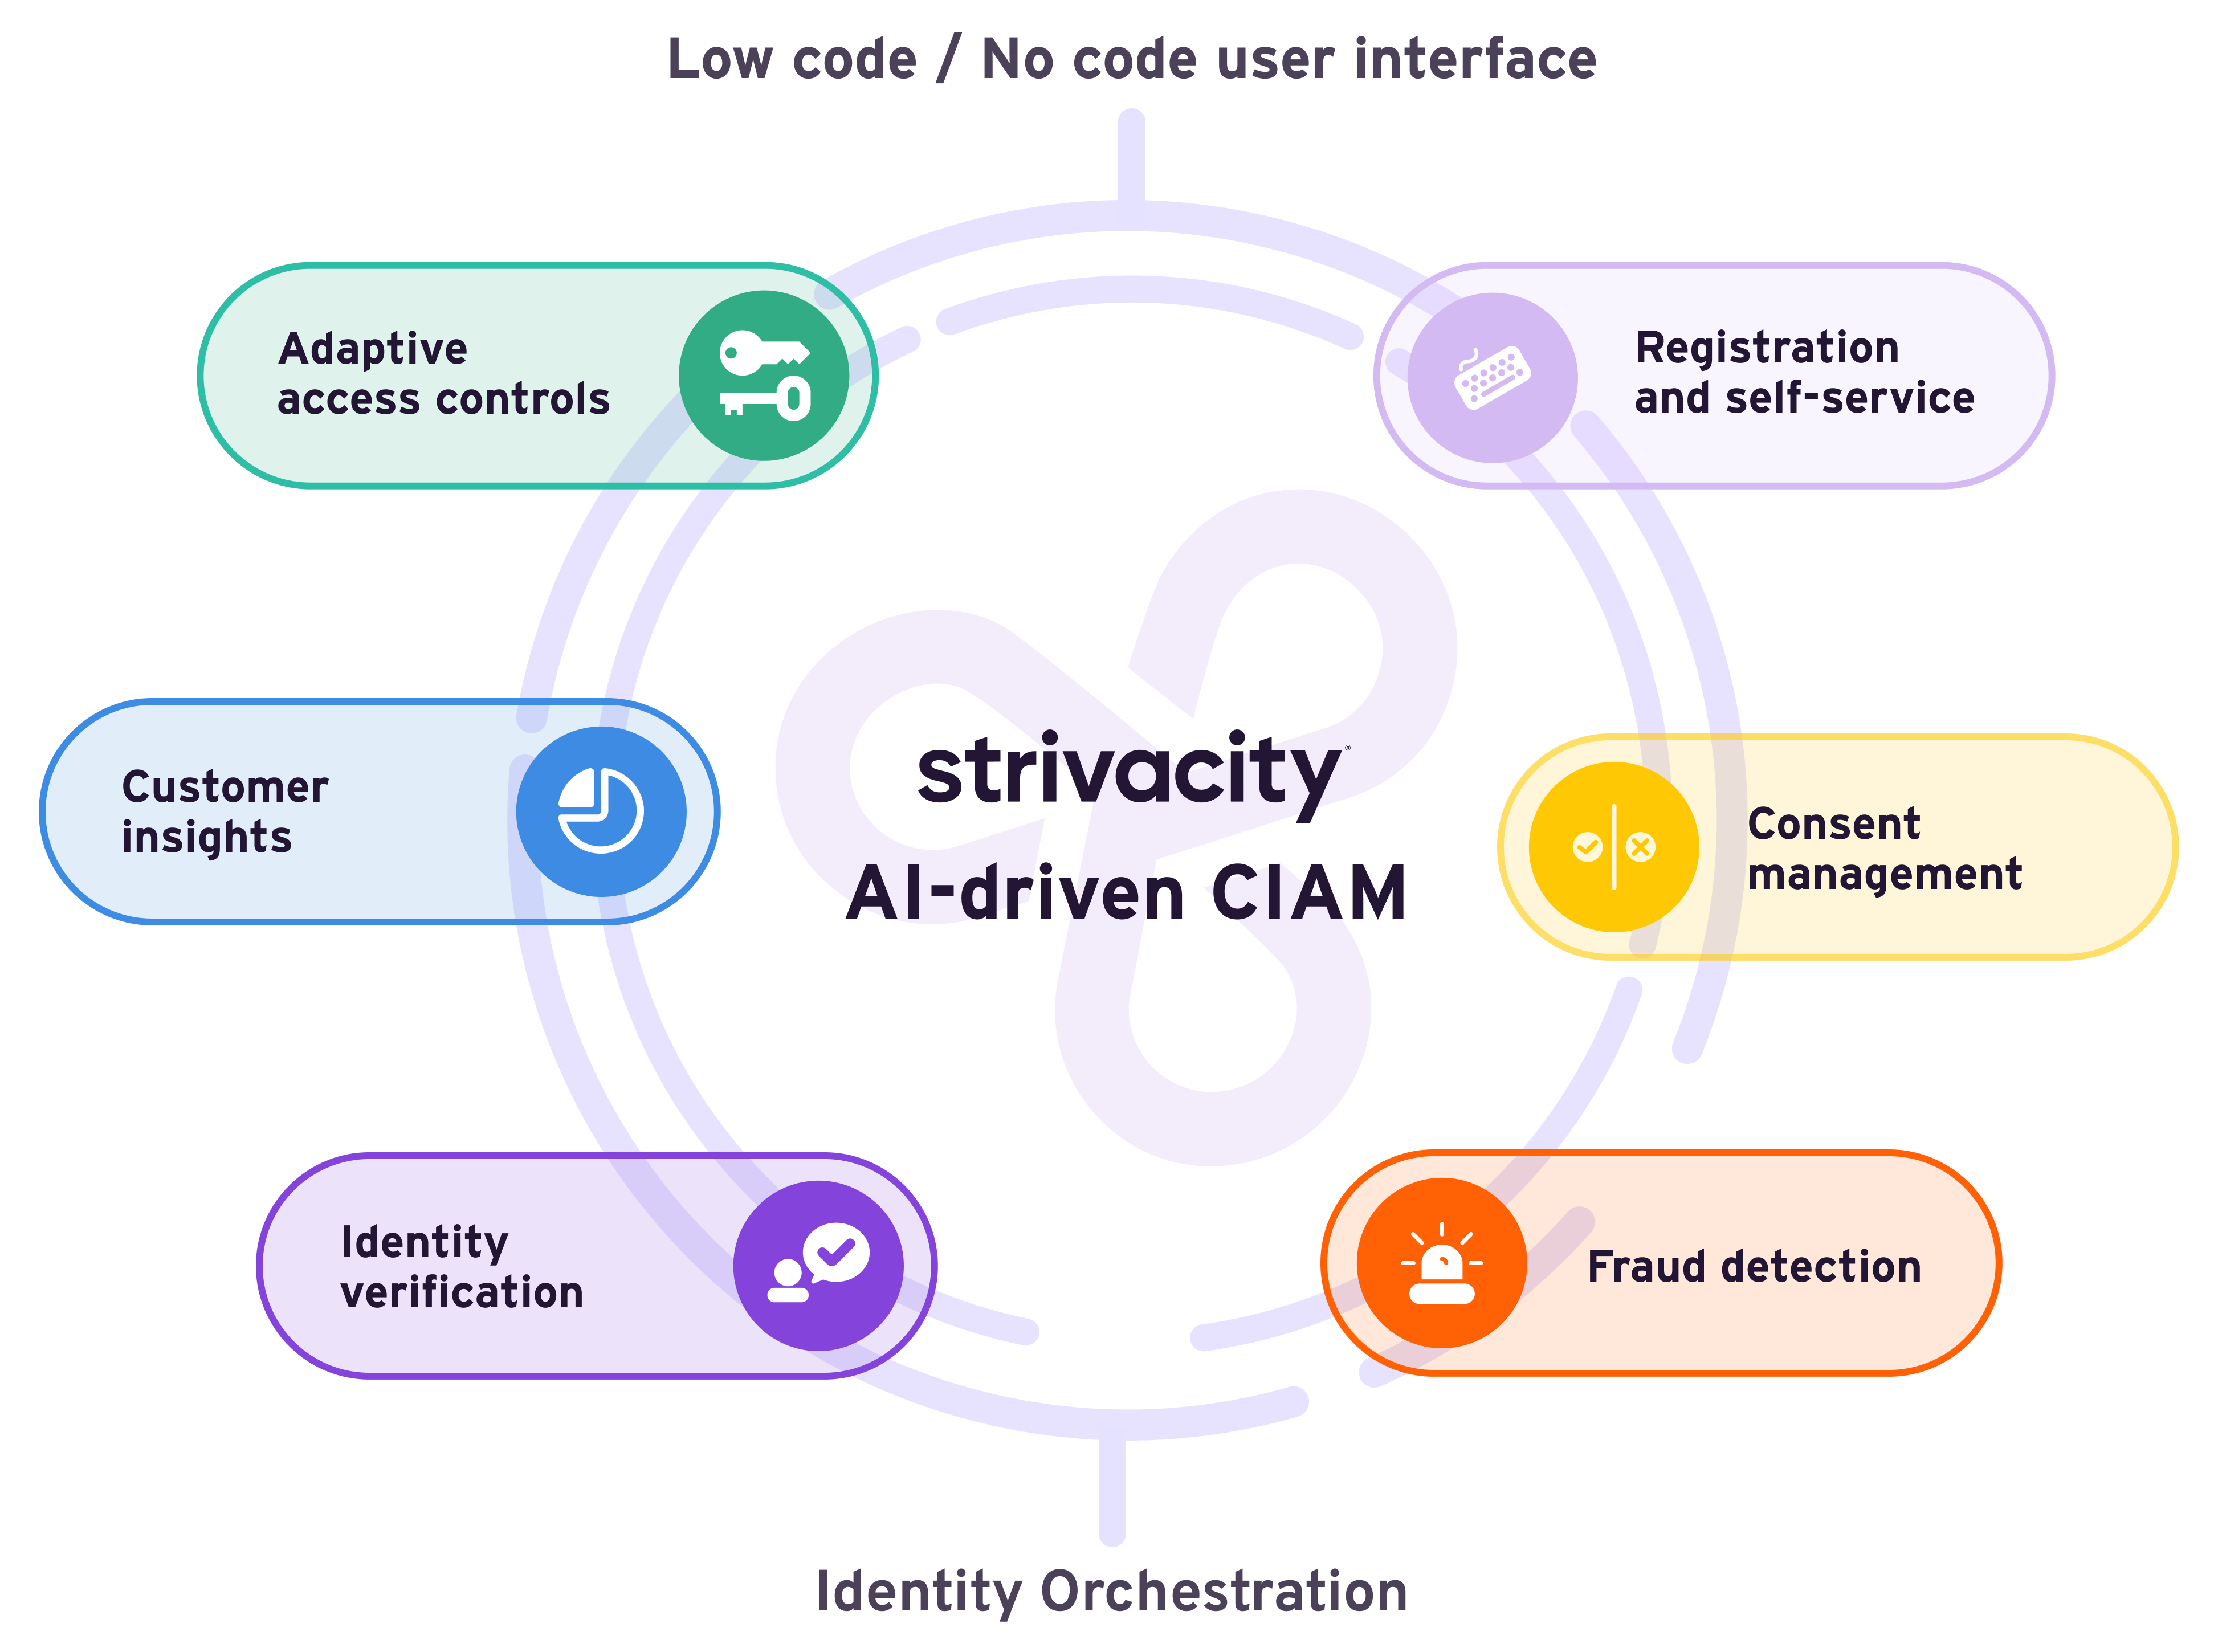
Dashboard overview
You can find useful metrics about your Strivacity instance that you can turn into insights
The Dashboard provides real-time insights into how your customers are using your web portals and applications powered by Strivacity.
The information displayed in the dashboard is cumulative of the activity for all configured applications and identity stores unless filtered down by application. Exception: active accounts are always calculated for all applications regardless of the filter state.
Stylized dashboard
Metrics
You can find the following metrics on the dashboard:
Widget | Description |
---|---|
Active Accounts | The chart displays the number of active accounts logged in over a selected time range in a monthly breakdown across all identity stores. Active accounts are equivalent to monthly active user counts, or MAUs. |
Logins | The number of successful and unsuccessful logins |
Registrations | The number of newly created customer identities via self-service or the Admin Console |
Total Customer Identities | The total number of customer identities across all identity stores |
Enterprise Logins | Displays 1) the total number of enterprise logins and 2) the number of enterprise logins broken down by each configured enterprise login provider |
Enterprise Registrations | Displays 1) the total number of enterprise registrations and 2) the number of enterprise registrations broken down by each configured enterprise login provider |
Social Logins | Displays 1) the total number of social logins and 2) the number of social logins broken down by each configured social login provider |
Social Registrations | Displays 1) the total number of social registrations and 2) the number of social registrations broken down by each configured social login provider |
Adaptive MFA Usage | The number of logins using each configured Adaptive MFA method |
Abandoned Logins | The total number of abandoned logins - an indicator that an attacker was unable to continue during the login process, or a legitimate customer decided not to continue to login |
Password Resets | The total number of successful password reset requests using self-service |
Forgotten Username Requests | The total number of forgotten username requests using self-service |
Total Anonymous Identities | The total number of anonymous visitors that consents have been captured for |
Widget editor
You can rearrange metric widgets in a way that best suits your purposes.

Widget rearrangement
Filters
Dashboard metrics can be filtered by time ranges and applications.
Active accounts only provide data at an hourly granularity. This means that minute-level data won’t be displayed for Active accounts when applying time filters under an hour. If the time filter spans across two hours, the metric will display data for both complete hours.
Filters by time & date
You can check the events of the last 2 hours up to conjuring data up from the year before:
You can use the calendar tool if you need metrics from a custom time range. You can also select your time zone.

Dashboard custom time range
Filtering stays just the way you left it the next time you return for more metrics.
Filter by application
You can check how individual applications are performing.
The Active Accounts and Total Customer Identities widget always show the cumulative data of all configured applications and identity stores, regardless of the application filter applied.

Dashboard data filtered by application
Data export
You can also fetch data from the dashboard in no time: click on Export Data to export selected dashboard widget results to a CSV file:
- from a specified time range
- from a selected application
- with a preferred time resolution

Data export dialog
You can include the following data points in your dashboard report for the selected range:
Data point | Data export name | Description |
---|---|---|
Successful logins | logins_successful | The number of successful logins where users reach the brand portal. |
Failed logins | logins_failed | The number of failed logins. Failed logins occur when users run out of attempts while trying to authenticate. Wrong username, password, or authenticator inputs all add to unsuccessful login attempts. |
Abandoned logins | logins_abandoned | The number of abandoned logins. A login is considered abandoned if the max-age of the login session expires. This can happen if users are unaware of being forwarded to their login session with Fastpath. |
Successful registrations | registration_successful | The number of account registrations. Successful account registration comprises a unique entry for each required identifier type, the enrollment of mandatory MFAs, a password that meets the password policy criteria, passing progressive profiling if applicable, and passing ID verification if applicable. |
Total accounts | total_accounts | The number of existing accounts. |
Successful forgotten username requests | forgotten_username_successful | The number of times an existing account was detected for the email address provided for the username reminder. In this case, Strivacity tries to send the username reminder to the recipient. |
Failed forgotten username requests | forgotten_username_failed | The number of times no account was detected for the email address provided for the username reminder. In this case, there is no email delivery attempt by Strivacity. |
Successful password resets | password_reset_successful | The number of successful password resets. |
Failed password resets | password_reset_failed | The number of unsuccessful password resets. Password reset can be unsuccessful if the reset link didn’t make it to the user or the user couldn’t set up a valid password in the available tries. |
Consent acceptance | consentId_version | The number of total opt-ins for a consent at a given point in time (on an hourly or daily basis depending on the time resolution selected). The number can increase or decrease depending on how many consent grants and revokes occurred, either by users or administrators. Consents are listed by consent id and version, each version showing separate data points. “0” consent opt-in can appear in statistics if there was a point in time (either before or after) when the consent has been accepted. |
Updated 2 months ago