Using the IDE
The IDE (integrated development environment) is where you write, test, and manage the logic for your lifecycle event hooks. Each hook runs in response to a specific point in a customer journey, and the IDE gives you the tools to define what happens at that moment. You can review the context passed into the hook, add business logic, run test executions, and inspect debug output within the same interface.
Settings
The left-hand panel of the IDE provides context and configuration options for the selected event hook.
- Name: The display name of the hook, used to identify it in the Admin Console.
- Description: An optional field to summarize the hook’s purpose.
- Policy tag: A label used to categorize and identify event hooks.
- Type: Indicates the point in the customer journey where this hook runs (for example, Before multi-stage registration). This is set when the hook is created and cannot be changed later.
- Mode: Specifies whether the hook is blocking (synchronous) or non-blocking (asynchronous). Blocking hooks must complete execution before the journey can proceed.
- View event hook logs: Opens the Logs tab and displays the executions of the current hook. The view is automatically filtered by hook ID so admins can focus on relevant log entries without needing to manually search.
- Delete hook: Permanently deletes the hook. This action is irreversible and is located in the Danger zone section.
Main IDE screen
The below screen and table describe the various elements and functions of the main IDE screen:
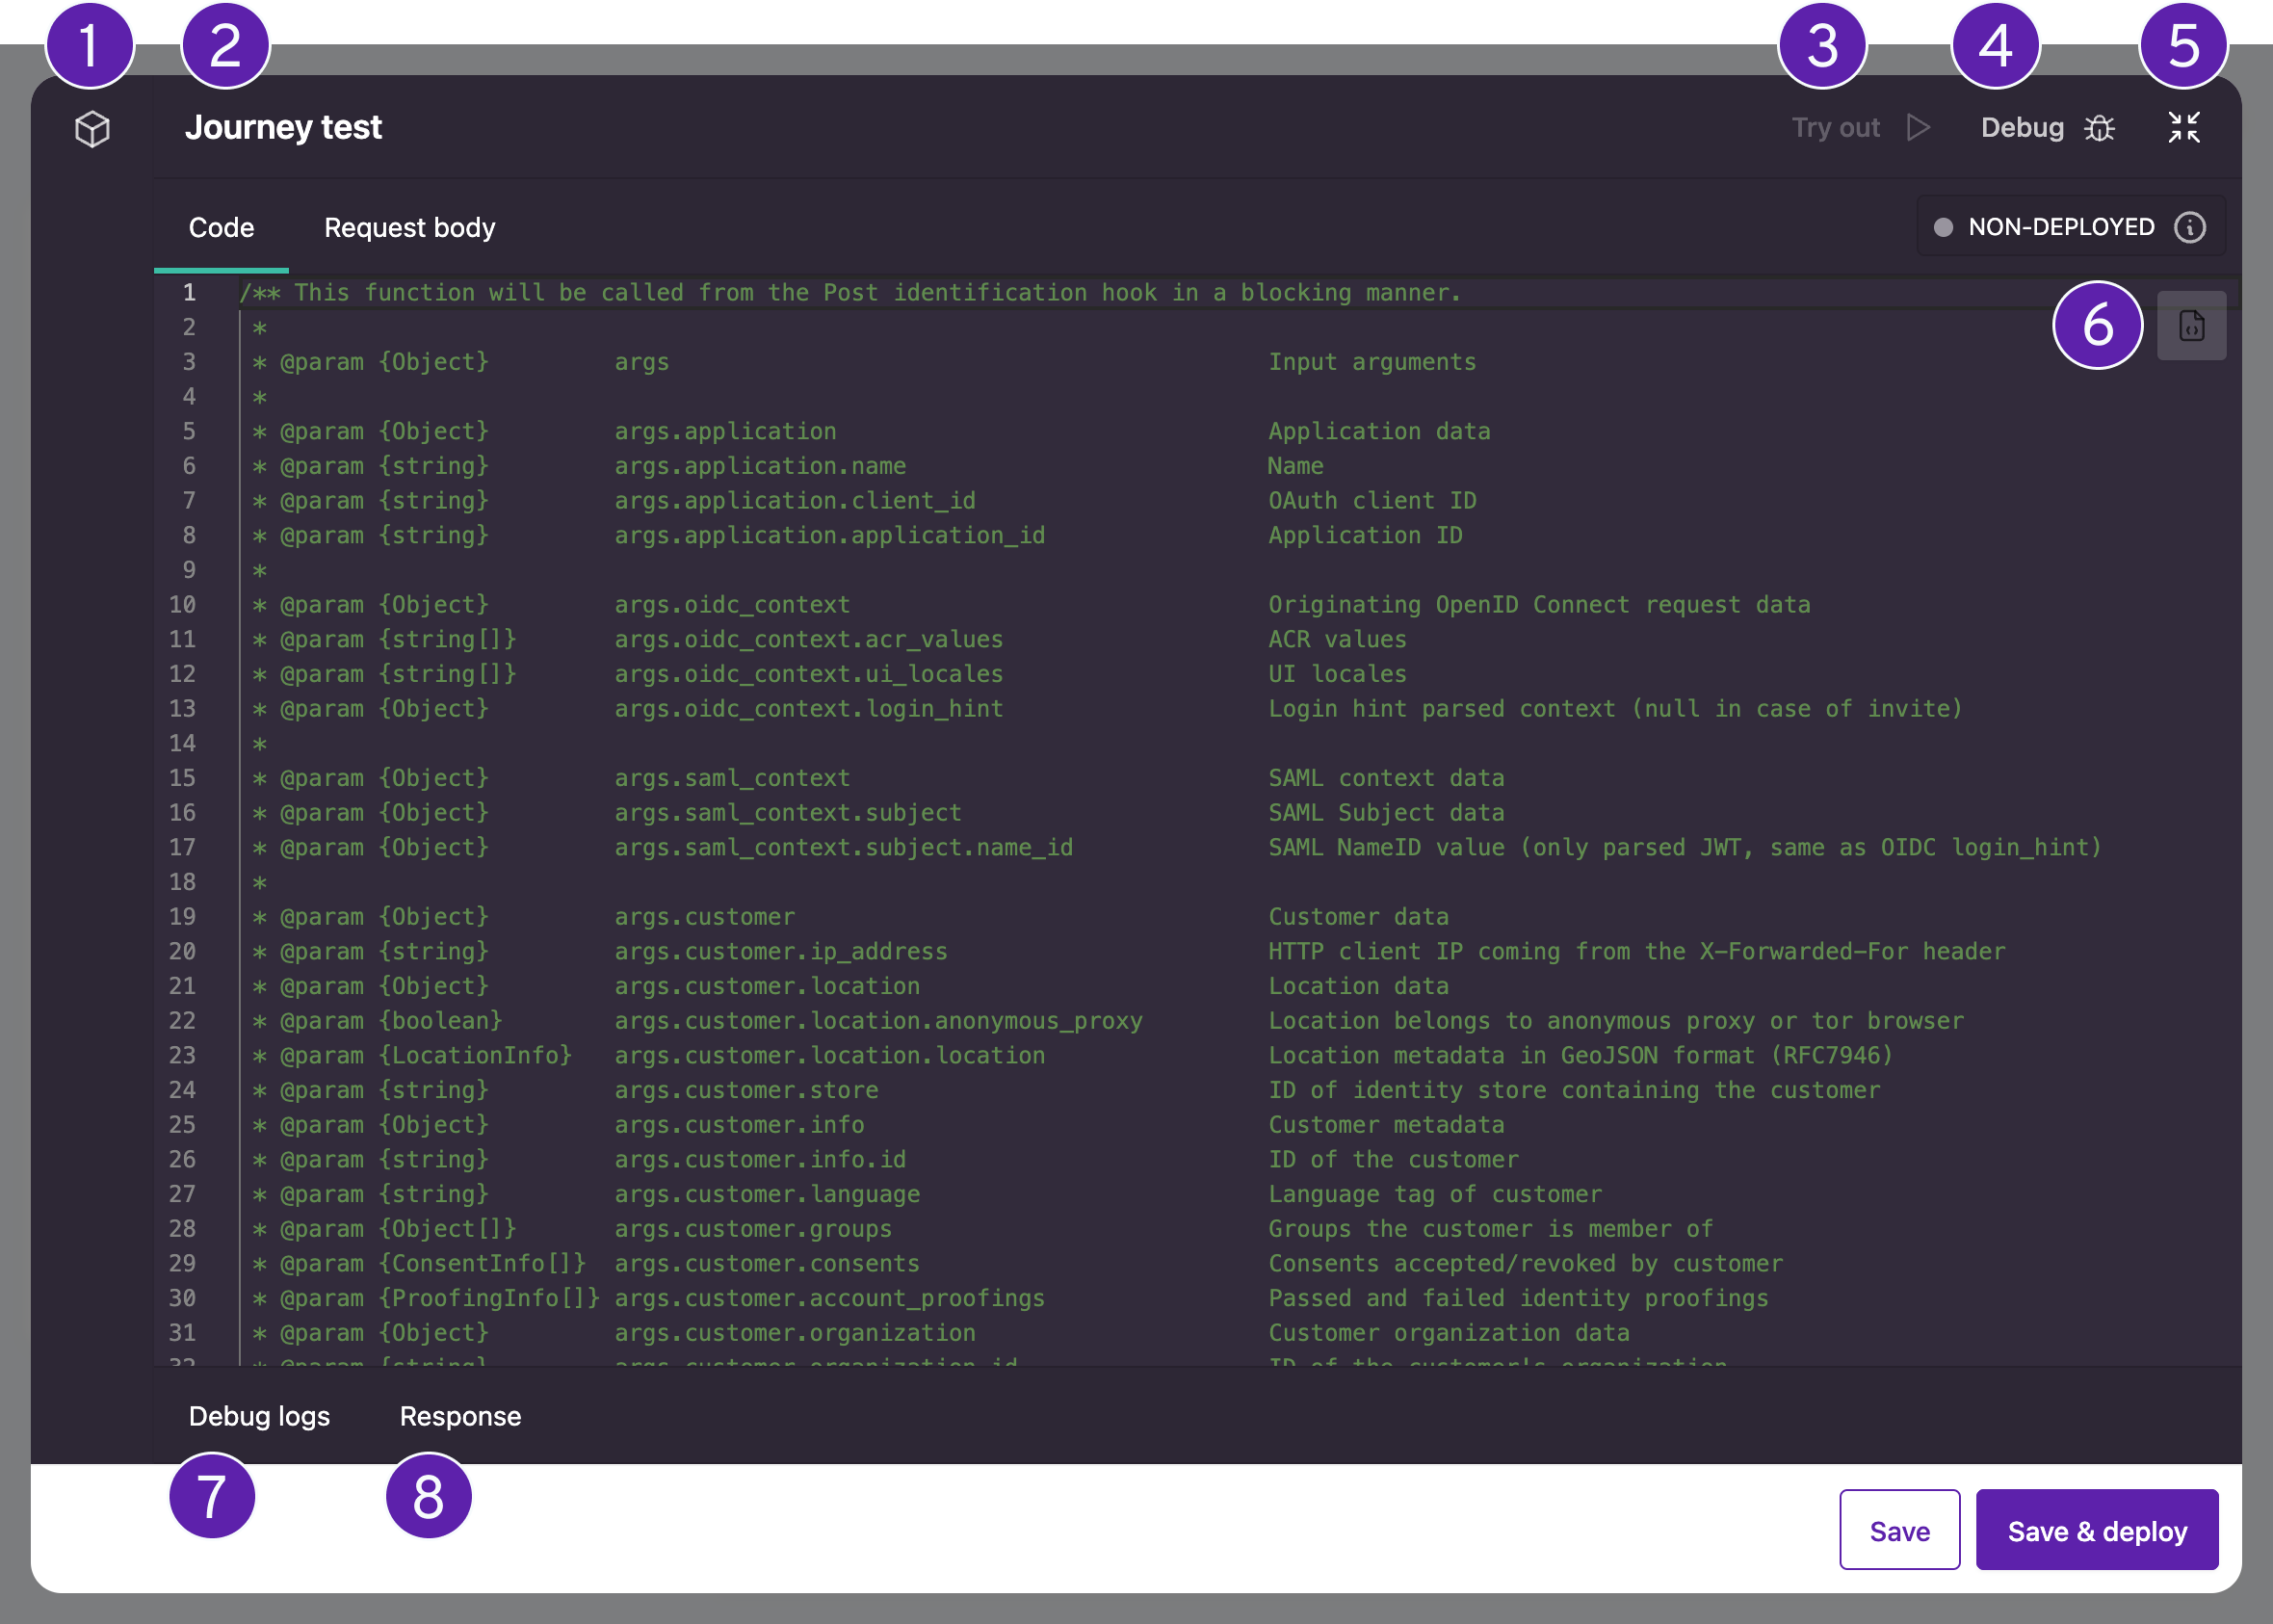
| IDE Element | Name | Description |
|---|---|---|
| 1 | Settings menu | Displays the IDE settings for this function. Here you can manage dependencies from the NPM registry (https://www.npmjs.com) and access Variables and secrets. |
| 2 | Hook name | Displays the name of the current event hook that you are working with. |
| 3 | Try out | This triggers the event hook to execute as if it were being triggered during the actual event. You can use this for testing purposes to ensure that your code snippet is working correctly. |
| 4 | Debug mode | Toggling Debug Mode allows you to use the Try Out feature. In real time, you can see log output from the event hook as it executes. |
| 5 | Toggle screen size | Toggles the IDE view between windowed to full screen. |
| 6 | Code snippets | Displays a list of pre-written code snippets to perform specific functions or tasks. |
| 7 | Debug logs | When Debug Mode is enabled, log output from the event hook is visible in the Debug Logs window. |
| 8 | Response | Shows the results of the call after using the 'Try Out' feature. |
Code snippets
Code snippets are short, reusable pieces of code you can quickly add to your event hooks. Instead of writing code from scratch, this feature allows you to just drop in a snippet and tweak it as needed. Using the available snippets also ensures your code follows best practices and serves as a guide on how to implement common tasks.
How to use code snippets
- Start by logging into the Admin Console using an admin account.
- From the left-hand menu, select Lifecycle event hooks.
- You will see a listing of all your already created event hooks. If you want to add a new one, select +Create lifecycle event hook.
- In the IDE, place your cursor where you need the code, select Code snippets, and choose from the list. For example, the 'after identification screen' snippet allows you to display a custom screen right after the user completes the identification step.
Depending on what kind of event hook you initially selected, different types of code snippets will be available that work in that context. - Adjust the snippet to fit your specific needs.
- Run your hook to make sure everything works as expected. To do so, toggle Debug mode and select the Try out option.
Updated 2 months ago